Commodities continue in an uptrend as reflected in the chart of the CRB index.
Wheat continues to consolidate in this price range.
Soybeans continue in an uptrend.
Sugar is in an uptrend as well.
Combo charts
The Euro is approaching a top again around $1.49 which we saw in November and again in January -currencies.
Oil may have topped out for now -we'll see.
Stocks are heading higher for now based on the 2 interest rate cuts from the Fed.
Note: Charts are 'live' so above comments refer to the appropriate time on the chart.
January 12th update
The Crop Report was released on Friday, sending grain prices higher again (see charts). Corn was 'limit up' all day, meaning that it never traded because the opening price was higher than the maximum price move allowed in one day! (see that dot on the chart at 495...)
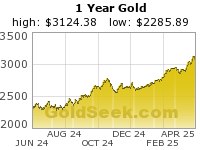
Gold touched $900 per oz. for the first time ever, while Crude Oil retreated to around $93 on recession fears. The US Dollar lost some ground this week as well based on expectations for another interest rate cut.
Charts -the BIG picture:
Grain prices are normally seasonal, and rise and fall within a price range as each season comes and goes, with an occasional large spike in a really bad year. What we are experiencing however is not a seasonal rise in prices, but rather a longer term up trend as demand continues to outstrip supply. Translation -the Chinese are eating all our food, and the rest is being converted and put in our gas tank as ethanol!
CORN prices peaked in Jan 2007 at more than double the previous year; this month it is at an even higher level
SOYBEANS prices are up more than double from just over a year ago and the highest in over 25yrs
WHEAT prices up more than triple from just over a year ago and the highest ever on record
CRUDE Oil -well, just look at the 25yr chart; ditto Heating oil (HO) aka Diesel (transportation costs go higher!).
Subscribe to:
Posts (Atom)